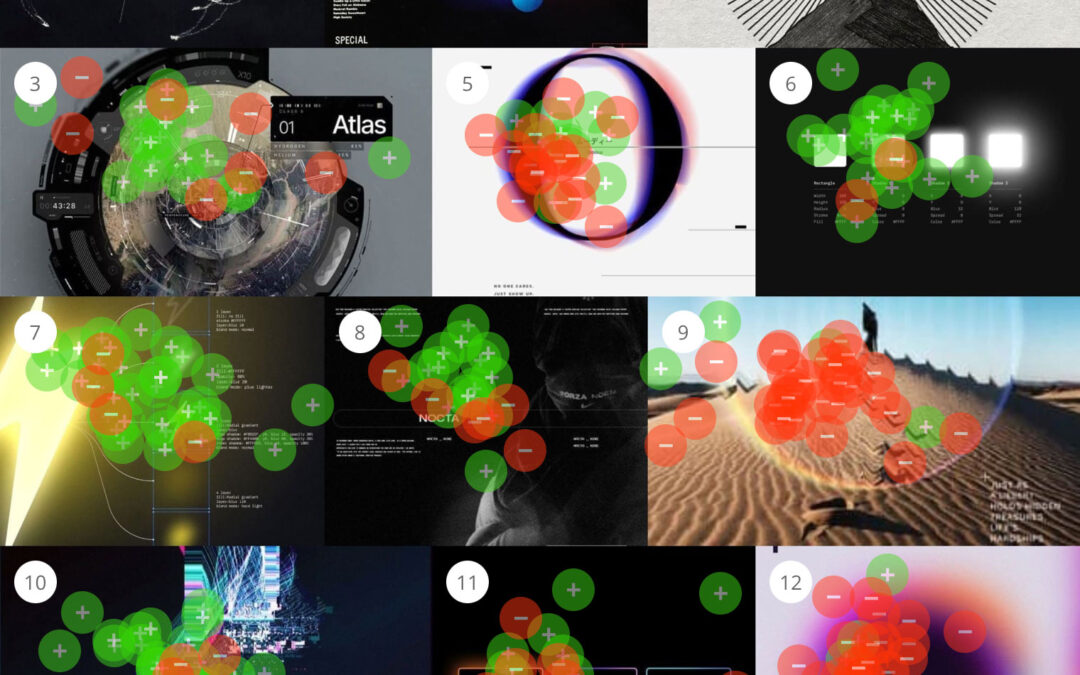
by Joseph Fioramonti | Dec 1, 2025 | study-results
What Does “Visual Data” Look Like The Data You Don’t Read but Still Believe In We asked 50 emerging designers to rate what looks like visual data and what doesn’t. The findings challenged our assumptions and revealed that structure, not style, drives...
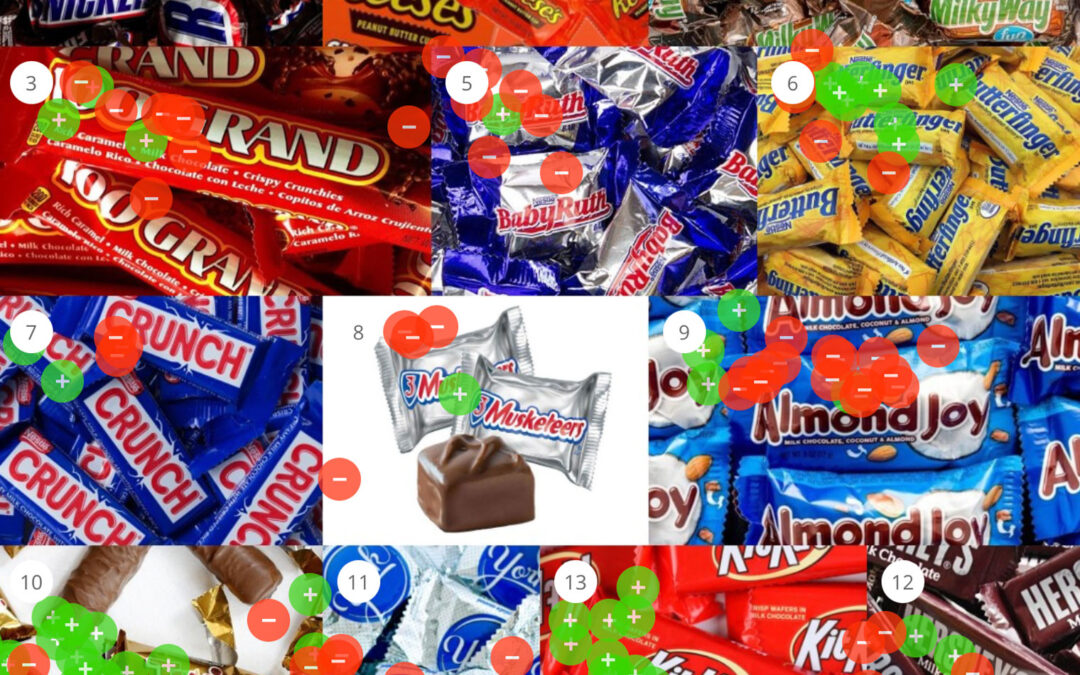
by Joseph Fioramonti | Nov 5, 2025 | study-results
Perception Map Test: What Is Your Favorite Halloween Candy? This test asked participants a deceptively simple question: What is your favorite Halloween candy? Behind the wrappers, though, the answers revealed powerful emotional codes. From generational classics to...
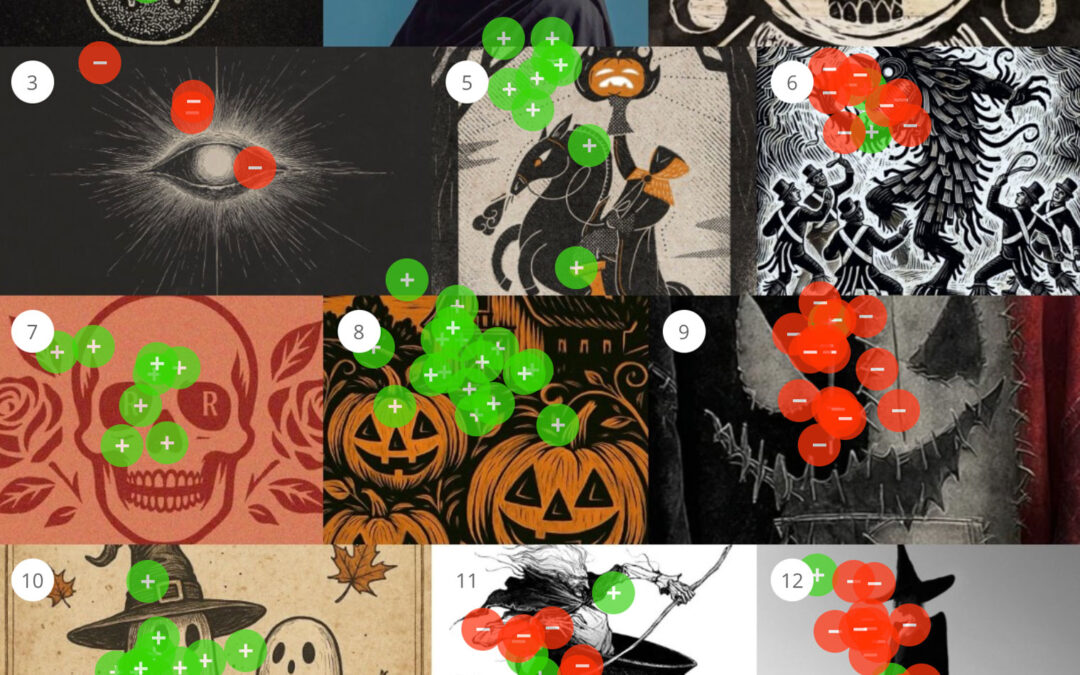
by Joseph Fioramonti | Oct 15, 2025 | study-results
Is it “Spooky” or “Scary”? A visual study of how people separate spooky from scary — and what that says about our modern relationship with fear. Halloween sits at the strange crossroads of delight and dread. Every October, our visual culture...

by Joseph Fioramonti | Jul 16, 2025 | articles
Due Diligence Is Now a Strategic...
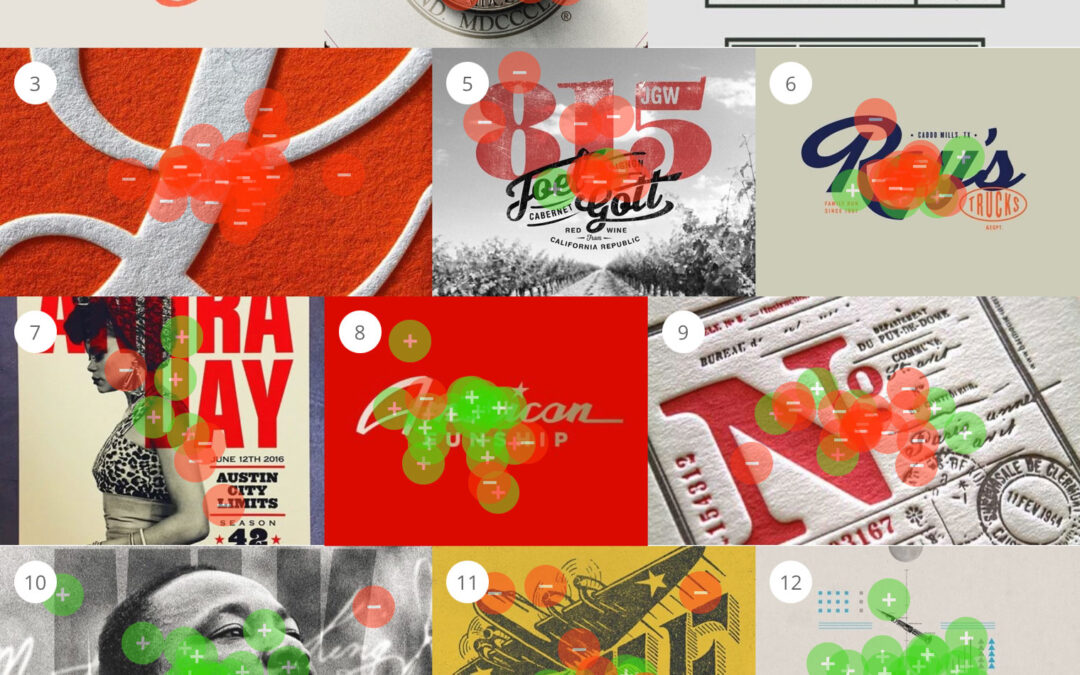
by Joseph Fioramonti | Jul 1, 2025 | study-results
What makes something look “American”? Perception Drives How National Identity Is Recognized We showed 57 people a mix of posters, stamps, logos, and packaging—all using familiar red, white, and blue palettes, stars, stripes, and vintage typography—and...
