
Audience Perception Maps + Aesthetic Data
Curious how your visuals are really perceived? Explore public perception tests and brand case studies that turn aesthetic intuition into measurable insight using the Constellations audience perception mapping tool. From early-stage concepts to polished campaigns, see how audience perception maps reveal what resonates and why.
Audience Perception Maps and Case Studies

InEight Rebrand: Evidence-Backed Identity for Enterprise Software
We aligned 22 stakeholders on an enterprise rebrand — without a single revision

Giving Prospective College Students a Vision Board For Their College Experience
Even simple changes to how a Constellations test is structured can reveal entirely different audience perceptions.
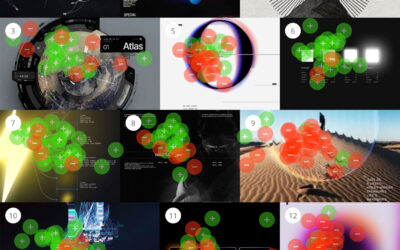
What Does “Visual Data” Look Like
Fifty designers rated visual data, revealing that structure—not style—is the key driver of visual trust and credibility.
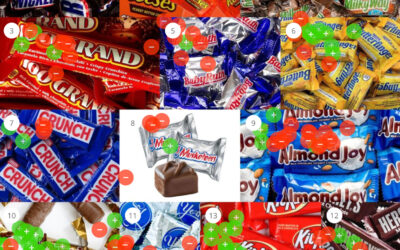
Everyone’s Favorite Halloween Candy
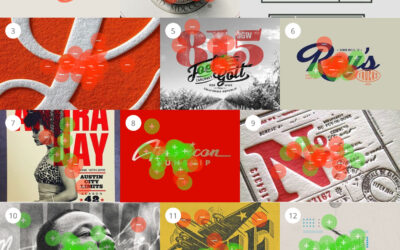
Perception Map...
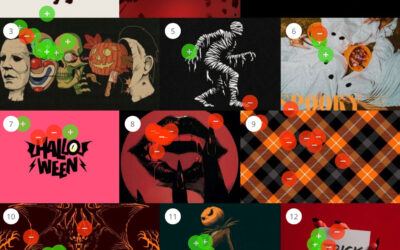
What Does “Halloween” Look Like to You?
What Does...
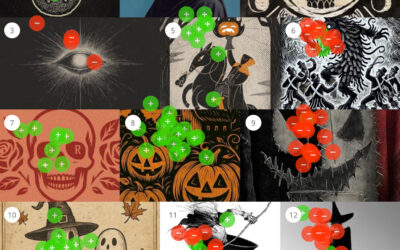
Spooky Or Scary?
Is it "Spooky" or...

Design Due Diligence
In fast-paced design, early visual testing with Constellations ensures better outcomes, alignment, and confidence from the start.
What does “American” Look Like?
For July 4th, we explored what “American” looks like in 2025—revealing shared civic values through visual perception mapping.
Mailing List
Sign up to participate in interactive visual surveys and receive exclusive analysis reports on timely, trending topics—all from a visual perception perspective. You'll also get product updates, creative case studies, and smart ways to sharpen your visual strategy.